 Ordinarily, the release of a new football might not appear on your radar.
But every four years, Adidas reveal their new ball for the World Cup, and for 2022 the firm is promising that their new sphere will retain its speed through the air much better.
“The game is getting faster and, as it speeds up, accuracy and flight stability becomes critically important,” so said Adidas’ design director, Franziska Loeffelmann.
“The new design allows the ball to maintain its speed significantly higher as it journeys through the air.”
She also confirmed that Al Rihla, which means ‘the journey’ in Arabic, ‘travels faster in flight than any other World Cup ball.’
All of which is excellent news for attacking players and set piece specialists, but not so much for goalkeepers trying to keep the speeding leather dome from entering their net.
The naysayers will suggest this is all hyperbole on the part of Adidas, and only time will tell if that’s true or not. But for anybody with an interest in betting on World Cup games, there is the possibility that this could be the highest scoring edition of the tournament in history.
But are World Cups, in general, seeing more or fewer goals in the modern age?
Which World Cup Had the Most Goals?

When we look at which World Cup has been the highest scoring, there are two metrics that we need to consider: total goals and goals per game.
The earliest iterations of the World Cup only had as few as 18 games played, whereas since the expansion of the format in 1998 – where 32 teams would battle it out for the Jules Rimet Trophy instead of 24 – some 64 games are now played in the tournament.
And, for the 2026 edition in North America, that will once again be expanded to 48 teams.
But as far as past tournaments are concerned, here’s how many goals each World Cup has enjoyed, starting with 1930 through to England’s triumph in 1966:
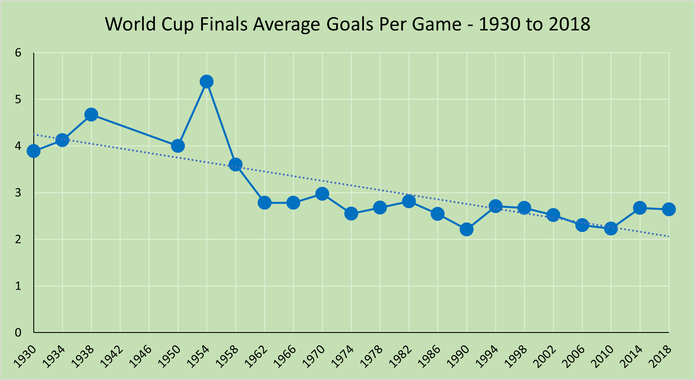
World Cup Finals Average Goals Per Game – 1930 to 1966
| Year | Games | Goals | Average |
|---|---|---|---|
| 1930 | 18 | 70 | 3.89 |
| 1934 | 17 | 70 | 4.12 |
| 1938 | 18 | 84 | 4.67 |
| 1950 | 22 | 88 | 4 |
| 1954 | 26 | 140 | 5.38 |
| 1958 | 35 | 126 | 3.6 |
| 1962 | 32 | 89 | 2.78 |
| 1966 | 32 | 89 | 2.78 |
As you can see, the World Cup was an astonishingly high-scoring tournament in its early years, and there are a number of reasons for that (more on those later).
Surprisingly, as the format expanded to first 35 and then 32 games per edition, the number of goals-per-game decreased….flying in the face of the logic that adding more teams would create an increase in one-sided, goal-heavy contests.
So the number of goals per World Cup decreased markedly from 1930 to 1966….was the same pattern been at play from 1970 to 2018?
Year No. of Games No. of Goals Avg Goals per Game
World Cup Finals Average Goals Per Game – 1970 to 2018
| Year | Games | Goals | Average |
|---|---|---|---|
| 1970 | 32 | 95 | 2.97 |
| 1974 | 38 | 97 | 2.55 |
| 1978 | 38 | 102 | 2.68 |
| 1982 | 52 | 146 | 2.81 |
| 1986 | 52 | 132 | 2.54 |
| 1990 | 52 | 115 | 2.21 |
| 1994 | 52 | 141 | 2.71 |
| 1998 | 64 | 171 | 2.67 |
| 2002 | 64 | 161 | 2.52 |
| 2006 | 64 | 147 | 2.3 |
| 2010 | 64 | 143 | 2.23 |
| 2014 | 64 | 171 | 2.67 |
| 2018 | 64 | 169 | 2.64 |
It’s fair to say that the number of goals per World Cup in the contemporary age is pretty consistent, with between 2.23 and 297 goals per game on average in each of the last 13 editions.

But, we can also conclude that World Cups are much lower scoring these days than they were decades ago, and so for all Adidas’ hyperbole – maybe their balls do move faster through the air? – there are other reasons why the most prestigious competition in football is seeing, for the most part, fewer goals than ever before.
Why Are There So Few Goals at the World Cup?

We should start by saying that the World Cup isn’t actually that shy of goals when compared to major club competitions around the globe.
The 2020/21 Premier League season saw an average of 2.69 goals scored per game, and that tallies with the other major domestic competitions in Europe: La Liga (2.51), Serie A (3.06), Bundesliga (3.03) and Ligue 1 (2.76).
Defensive Play
Of course, the World Cup is a global event, and there are clear cultural differences that determine how hard teams push for goals, or how they behave after taking a one-goal lead. Brazil’s Serie A, for example, averaged just 2.22 goals in 2021, which highlights the different dynamics in South America. Japan’s J-League recorded 2.43 goals-per-game, which is still less than Europe’s big five.
So, the reality is that the World Cup simply reflects the appetite for goals of all of its participating nations.
Tactics
Another thing to note is tactics. In the 1930s and thereafter, teams often deployed a 2-3-5 formation – that would be considered suicidal these days, but highlights why older editions of the World Cup were so high scoring.
Climate
We might consider the climate and temperature too….but actually you’d be wrong. The World Cups in the USA (1994) and Brazil (2014) saw more goals than those in Germany (2006) and Russia (2018), and that’s just a couple of examples. Greater heat does not necessarily mean a lower goal count.
Higher Standards
One thing that is certainly true is that the so-called ‘weaker’ teams have improved their levels. At World Cup 1930, some 10 of the 18 games played were won by a margin of three goals or more – that’s 56%. By the time the 2018 World Cup rolled around, that same stat had become 8/64 – just 13%.
So does each World Cup see so few goals? Well, it doesn’t, that’s the truth, when compared to domestic football. But a greater emphasis on defensive tactics, and a major improvement from the ‘lesser’ nations, has levelled the playing field somewhat.
The days of 5.38 goals-per-game on average at the World Cup are, sadly, consigned to the past!